
The dashboard shows the most valuable metrics that give you insight into the performance of your store and the behaviour of your customers. The metrics are shown in numeric format and also as graphs where appropriate. For all the metrics, the percentage change from the previous date range can also be shown.
The key areas to look at in Shopify Analytics
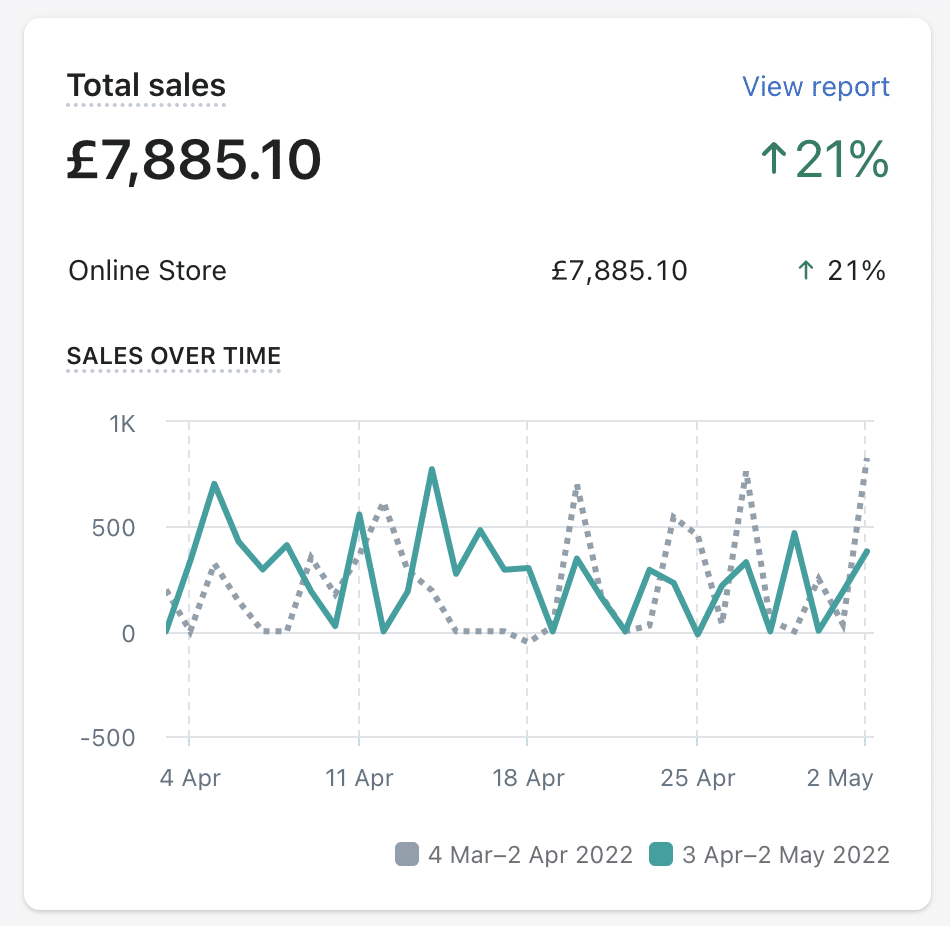
Check the value of your recent sales and compare them to a previous time period
This first graph available allows you to get a snapshot of how well your sales have been doing compared to the previous time period – week on week, month on month, year on year. This can be helpful to get a quick overview of how your sales are progressing.
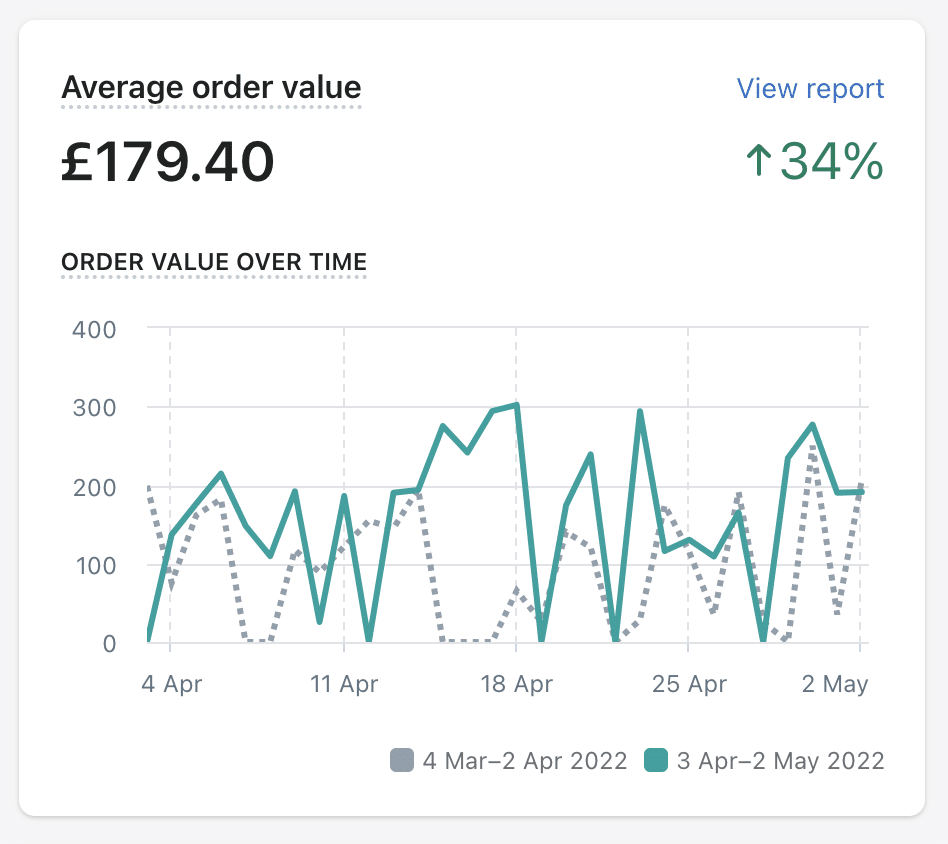
Track your average order value
Are your customers just buying a few items, or placing larger orders? This section can help you identify if there is scope to encourage larger orders and if that trend has changed over time.
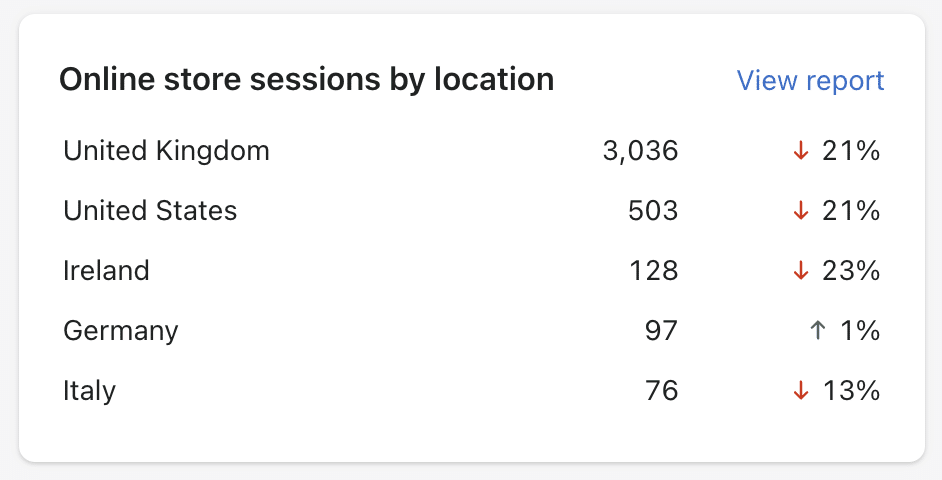
See where your visitors are coming from—by region or by social media source
What is the audience you are reaching – and how are they finding you? Getting an indication of where they are coming from (both physically and by media source) will help you to know where you can increase your efforts, and which sources produce the most visitors.
See a full guide on using Shopify Analytics here. If you need any help looking at your analytics, let us know how we can help.